
AP Physics 1
1.3 Representing Motion
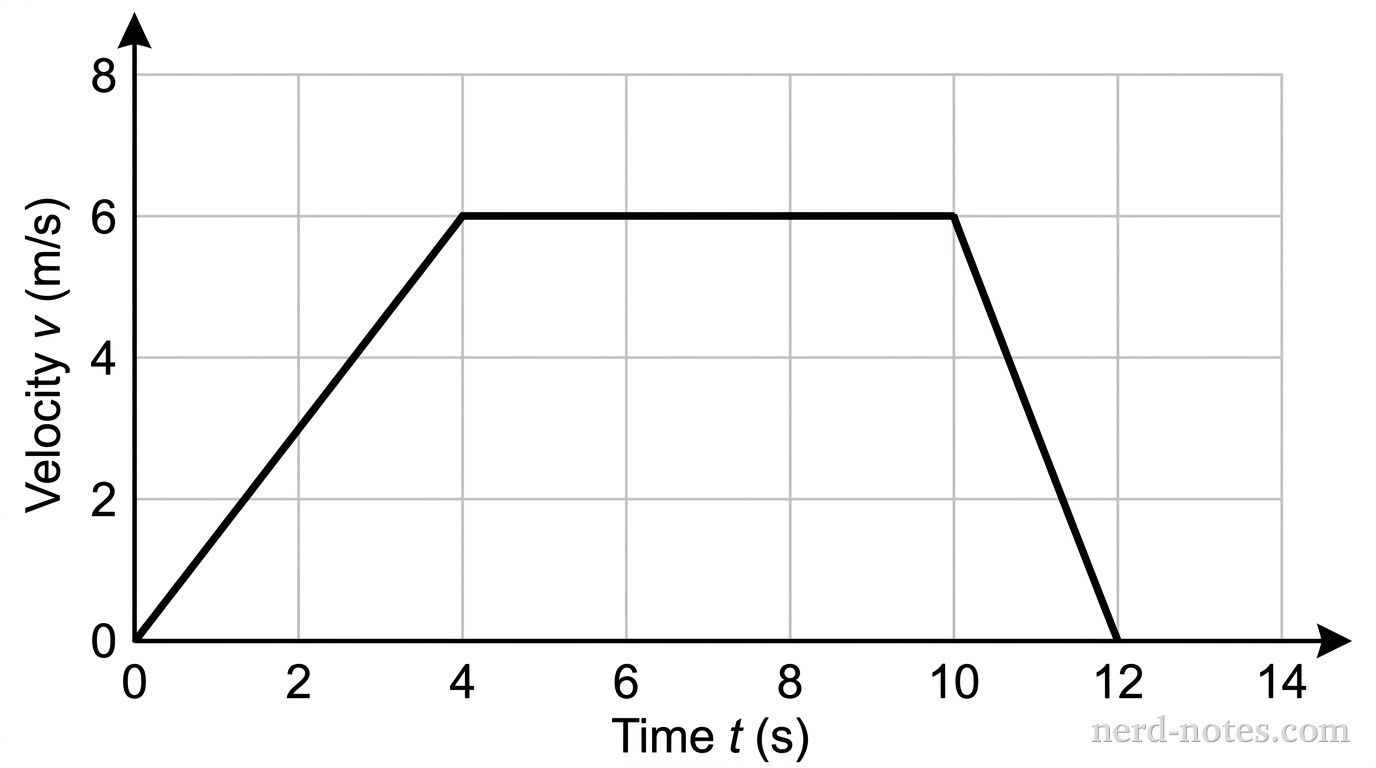
Based on the information in the graph, what is the total displacement of the car from \(t = 0 \text{ s}\) to \(t = 12 \text{ s}\)?
Similar Questions
Tools for a 5
 AP aligned mock tests to help you get a 5.
With grading, adaptive explanations, and more.
Find a Quiz
Find, solve, and grade every AP FRQ ever.
Find an FRQ
Elite Physics Tutoring with Jason.
Fast, 1 to 1 help on AP Physics 1. Understand weeks of complex concepts in just one session.
Book a Session
Learn AP Physics from scratch, quickly. This is the only course you'll need for the year.
A self-paced course with everything you need to get a 5. Trusted by over 15,000 students and 200+ schools. Learn fast, or we'll refund your purchase, backed by our 100% satisfaction guarantee.
Explore the Course