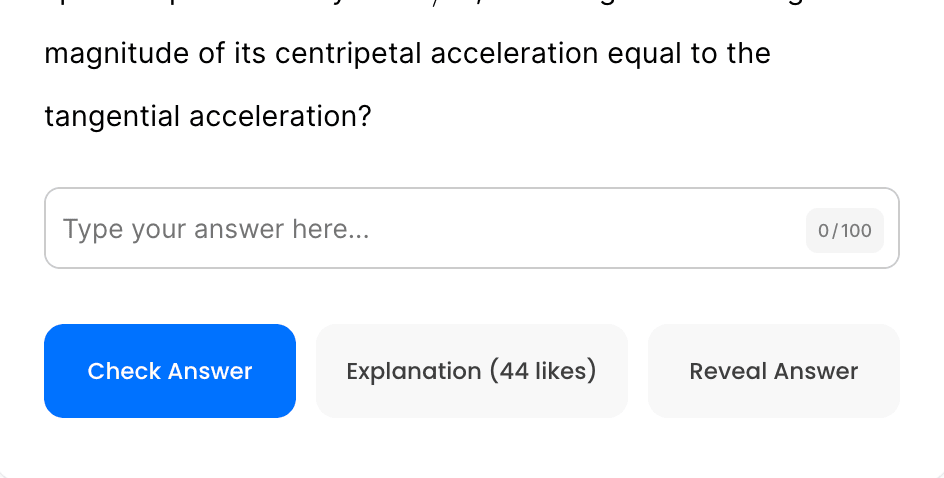
A disk of radius \( R = 0.5 \) \( \text{cm} \) rests on a flat, horizontal surface such that frictional forces are considered to be negligible. Three forces of unknown magnitude are exerted on the edge of the disk, as shown in the figure. Which of the following lists the essential measuring devices that, when used together, are needed to determine the change in angular momentum of the disk after a known time of \( 5.0 \) \( \text{s} \)?

A block is attached to a horizontal spring and is initially at rest at the equilibrium position \( x = 0 \), as shown in Figure \( 1 \). The block is then moved to position \( x = -A \), as shown in Figure \( 2 \), and released from rest, undergoing simple harmonic motion. At the instant the block reaches position \( x = +A \), another identical block is dropped onto and sticks to the block, as shown in Figure \( 3 \). The two–block–spring system then continues to undergo simple harmonic motion. Which of the following correctly compares the total mechanical energy \( E_{\text{tot},2} \) of the two–block–spring system after the collision to the total mechanical energy \( E_{\text{tot},1} \) of the one–block–spring system before the collision?
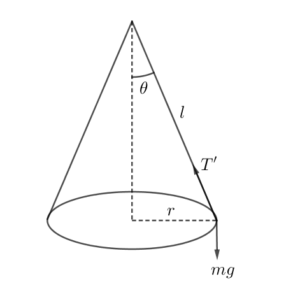
A conical pendulum is formed by attaching a ball of mass \( m \) to a string of length \( L \), then allowing the ball to move in a horizontal circle of radius \( R \).