
AP Physics 2
15.3 Emission and Absorption Spectra
15.2 The Bohr Model of Atomic Structure
15.1 Quantum Theory and Wave-Particle Duality
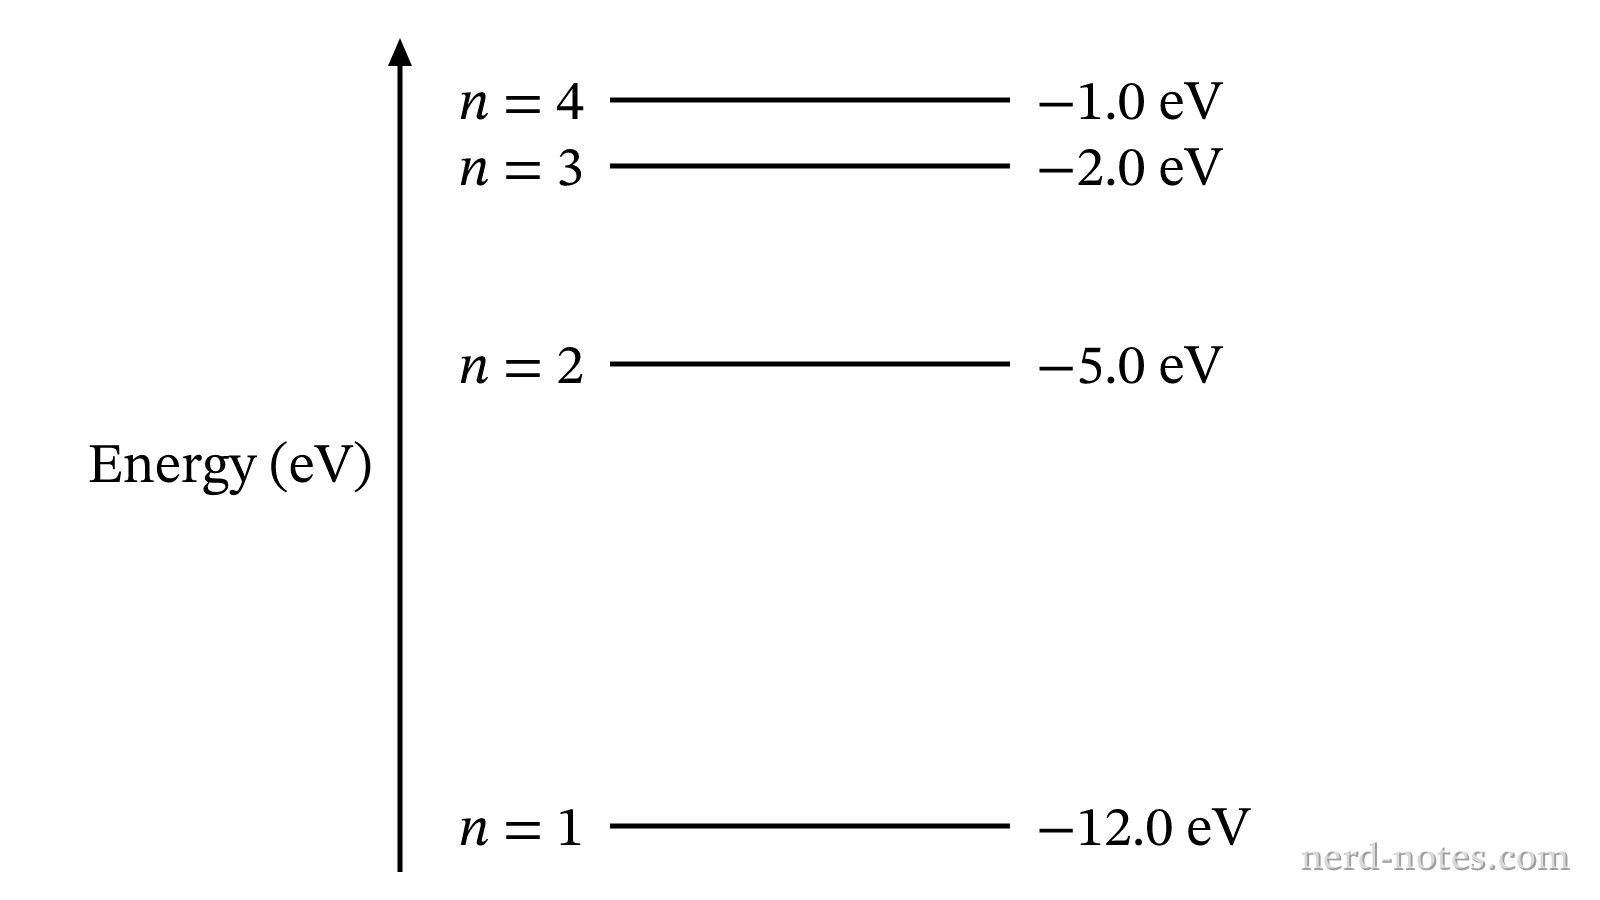
\(n=1\)). The energy levels of the atom are \(E_1 = -12.0\text{ eV}\), \(E_2 = -5.0\text{ eV}\), \(E_3 = -2.0\text{ eV}\), and \(E_4 = -1.0\text{ eV}\). Continuous white light passes through the gas to produce an absorption spectrum, while a separate electrical discharge excites a sample of these atoms up to the \(n=4\) state to produce an emission spectrum. What is the number of distinct dark absorption lines observed in the absorption spectrum, and which downward transition produces the photon with the longest wavelength in the emission spectrum?
Similar Questions
Tools for a 5
 AP aligned mock tests to help you get a 5.
With grading, adaptive explanations, and more.
Find a Quiz
Find, solve, and grade every AP FRQ ever.
Find an FRQ
Stuck on AP Physics 2? Get unstuck with an AP specialist.1 to 1 tutors who know the exam inside out. Understand weeks of material in a single session.Find a Tutor
Learn AP Physics from scratch, quickly. This is the only course you'll need for the year.
A self-paced course with everything you need to get a 5. Trusted by over 15,000 students and 200+ schools. Learn fast, or we'll refund your purchase, backed by our 100% satisfaction guarantee.
Explore the Course
AP aligned mock tests to help you get a 5.
With grading, adaptive explanations, and more.
Find a Quiz
Find, solve, and grade every AP FRQ ever.
Find an FRQ
Stuck on AP Physics 2? Get unstuck with an AP specialist.1 to 1 tutors who know the exam inside out. Understand weeks of material in a single session.Find a Tutor
Learn AP Physics from scratch, quickly. This is the only course you'll need for the year.
A self-paced course with everything you need to get a 5. Trusted by over 15,000 students and 200+ schools. Learn fast, or we'll refund your purchase, backed by our 100% satisfaction guarantee.
Explore the Course