All questions
AP Chemistry
2.3 Structure of Ionic Solids
2.2 Intramolecular Force and Potential Energy
AdvancedMCQGraphicalConceptual21.5k
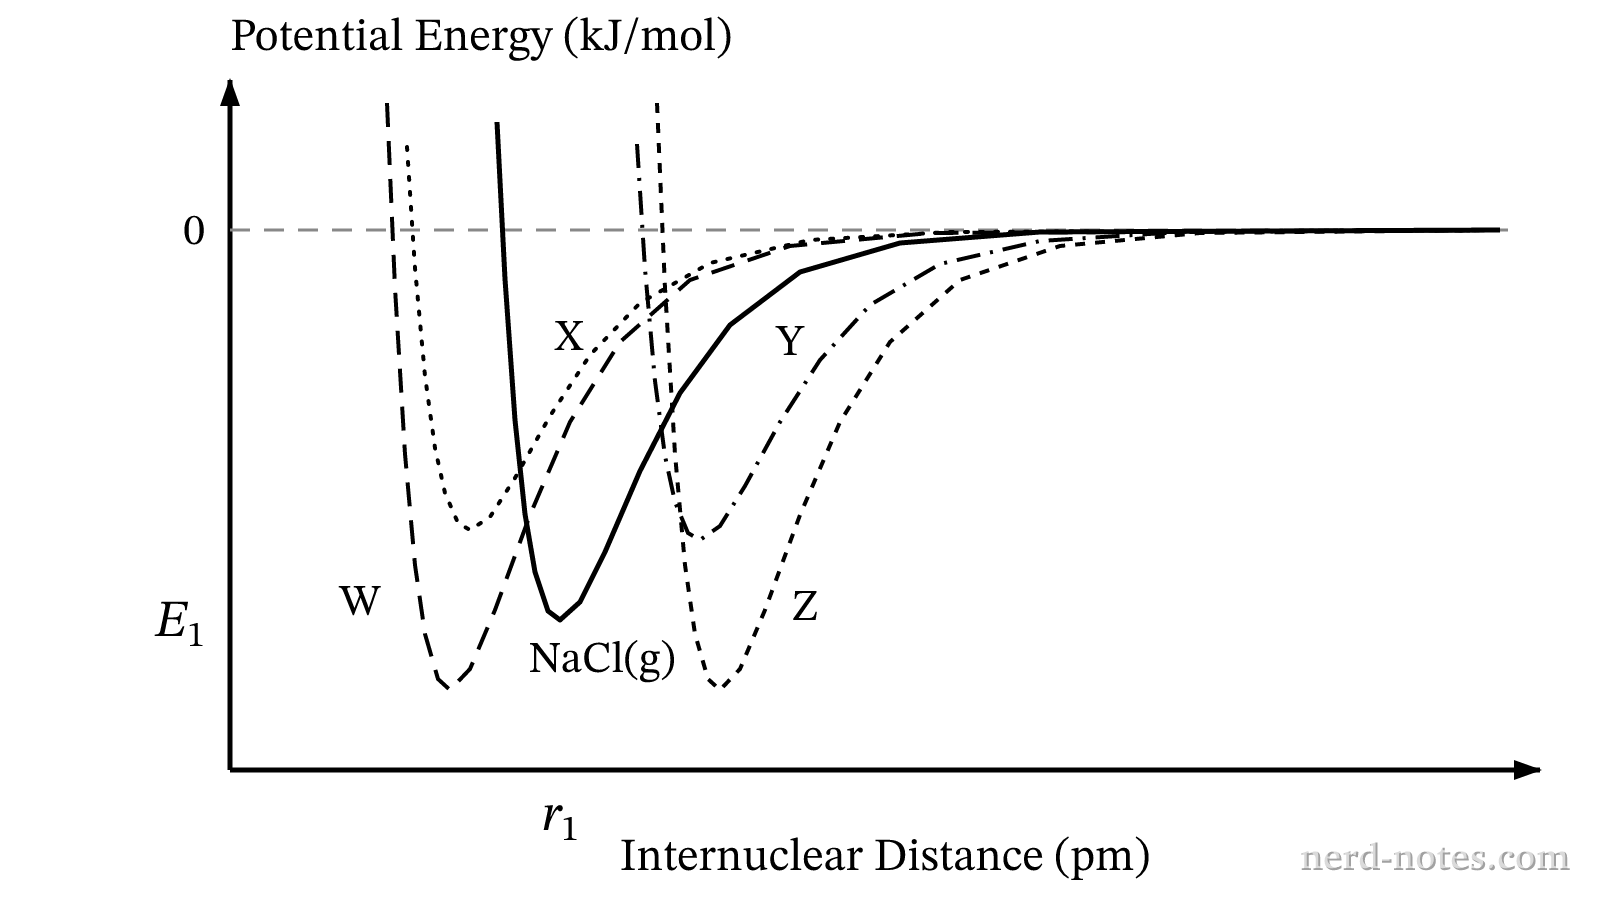
A grayscale potential energy plot with horizontal axis labeled Internuclear Distance (\(\text{pm}\)) and vertical axis labeled Potential Energy (\(\text{kJ/mol}\)). A horizontal dashed line indicates zero potential energy in the upper portion of the graph. A solid curve labeled \(\text{NaCl(g)}\) starts at high positive energy at small internuclear distance, drops steeply to a potential energy minimum at intermediate distance \(r_1\) and negative energy \(E_1\), and then asymptotically approaches the zero line as distance increases. Four labeled candidate curves appear with distinct minima: Curve W (dashed line) has its minimum to the left of and below \((r_1, E_1)\); Curve X (dotted line) has its minimum to the left of and above \((r_1, E_1)\); Curve Y (dash-dotted line) has its minimum to the right of and above \((r_1, E_1)\); Curve Z (short-dashed line) has its minimum to the right of and below \((r_1, E_1)\). All curves asymptotically approach zero potential energy at large internuclear distance. No other curves, data points, shaded regions, or annotations appear.
Potential energy as a function of internuclear distance for isolated gaseous ion pairs.
The potential energy curve for the interaction between isolated gaseous \(\text{Na}^+\) and \(\text{Cl}^-\) ions as a function of internuclear distance is represented by the solid curve in the graph above. A student predicts how substituting \(\text{K}^+\) in place of \(\text{Na}^+\) alters this curve. Which of the labeled curves best represents the potential energy curve for the interaction between isolated gaseous \(\text{K}^+\) and \(\text{Cl}^-\) ions, and what is the correct justification?

Log In to Continue

Accounts are free! Log in to try this question, see explanations, save progress, and more!

Tools for a 5