
AP Chemistry
7.2 Direction of Reversible Reactions
7.1 Introduction to Equilibrium
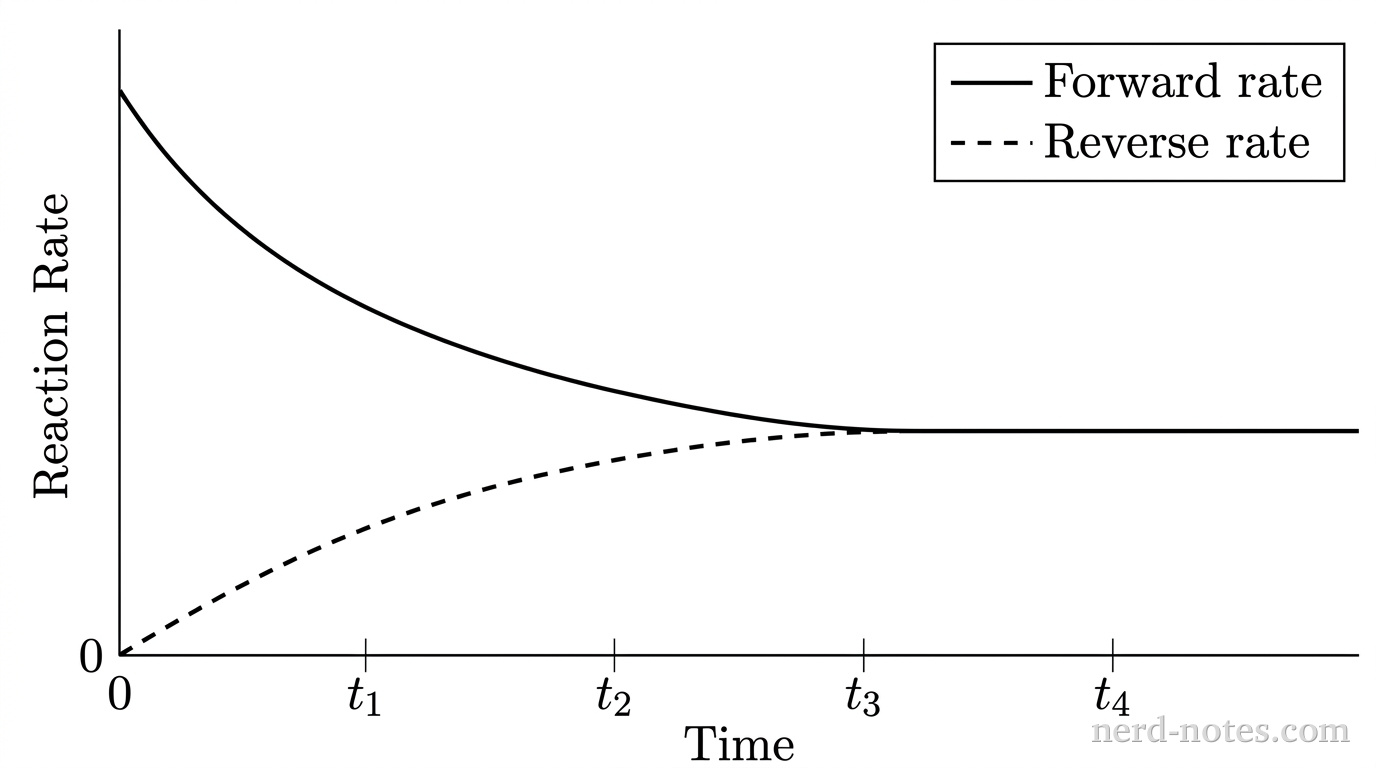
\[\text{N}_2\text{O}_4\text{(g)} \rightleftharpoons 2\,\text{NO}_2\text{(g)}\]
The rates of the forward and reverse reactions are monitored over time and plotted in the graph. Which of the following correctly identifies the time at which dynamic equilibrium is first established in the container, along with the valid justification?
Similar Questions
Tools for a 5
 AP aligned mock tests to help you get a 5.
With grading, adaptive explanations, and more.
Find a Quiz
Find, solve, and grade every AP FRQ ever.
Find an FRQ
Stuck on AP Chemistry? Get unstuck with an AP specialist.1 to 1 tutors who know the exam inside out. Understand weeks of material in a single session.Find a Tutor
Learn AP Physics from scratch, quickly. This is the only course you'll need for the year.
A self-paced course with everything you need to get a 5. Trusted by over 15,000 students and 200+ schools. Learn fast, or we'll refund your purchase, backed by our 100% satisfaction guarantee.
Explore the Course
AP aligned mock tests to help you get a 5.
With grading, adaptive explanations, and more.
Find a Quiz
Find, solve, and grade every AP FRQ ever.
Find an FRQ
Stuck on AP Chemistry? Get unstuck with an AP specialist.1 to 1 tutors who know the exam inside out. Understand weeks of material in a single session.Find a Tutor
Learn AP Physics from scratch, quickly. This is the only course you'll need for the year.
A self-paced course with everything you need to get a 5. Trusted by over 15,000 students and 200+ schools. Learn fast, or we'll refund your purchase, backed by our 100% satisfaction guarantee.
Explore the Course