
AP Chemistry
7.8 Representations of Equilibrium
7.4 Calculating the Equilibrium Constant
7.3 Reaction Quotient and Equilibrium Constant
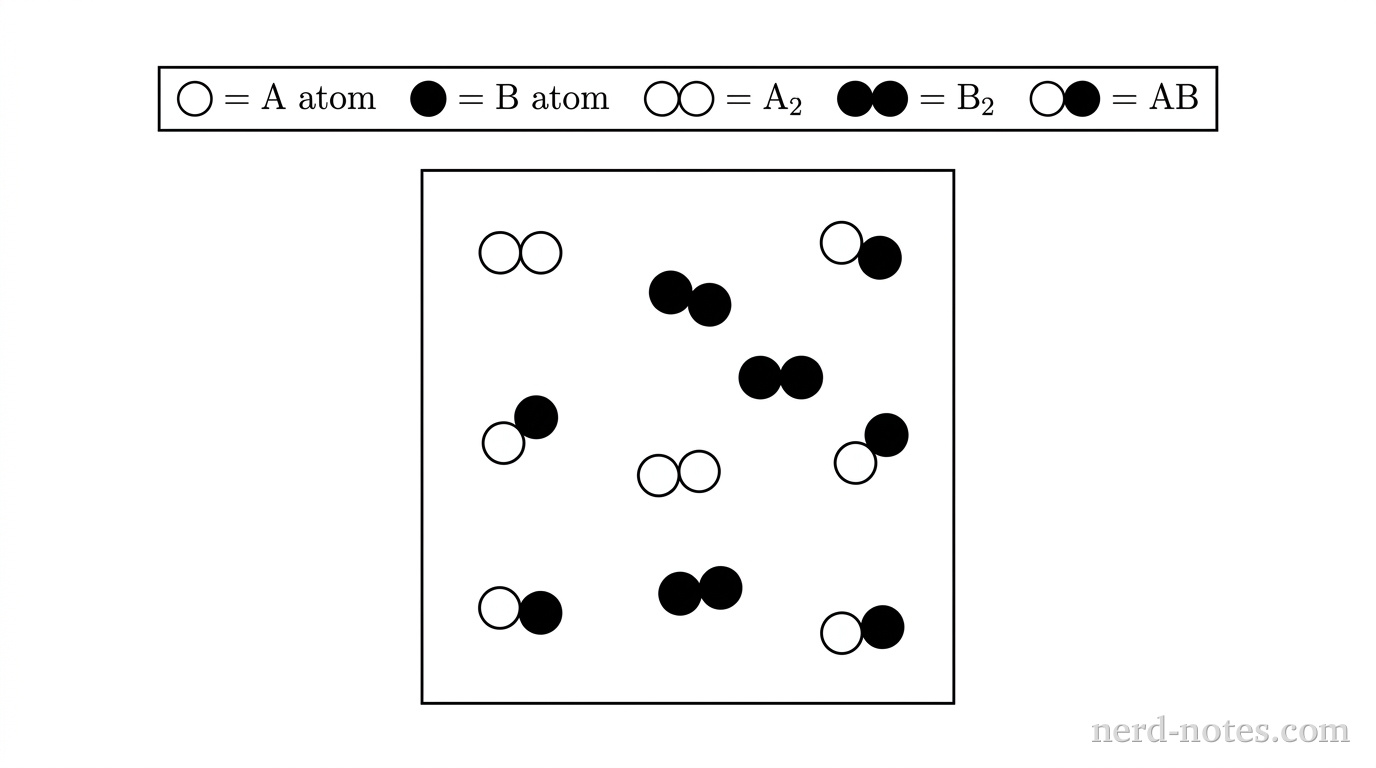
A reversible gas-phase reaction is represented by the equation above. In Experiment 1, a rigid \(1.0\text{ L}\) container at a constant temperature of \(500\text{ K}\) contains an equilibrium mixture consisting of \(2\) molecules of \(\text{A}_2\), \(2\) molecules of \(\text{B}_2\), and \(4\) molecules of \(\text{AB}\), as shown in the diagram below (where each particle represents \(0.10\text{ mol}\) of gas).
In Experiment 2, a second identical \(1.0\text{ L}\) rigid container at the same temperature of \(500\text{ K}\) is initially filled with \(6\) molecules of \(\text{A}_2\) and \(6\) molecules of \(\text{B}_2\) (\(0.60\text{ mol}\) of each gas) and allowed to reach equilibrium.
Which of the following particulate diagrams best represents the equilibrium mixture in Experiment 2?
Similar Questions
Tools for a 5
 AP aligned mock tests to help you get a 5.
With grading, adaptive explanations, and more.
Find a Quiz
Find, solve, and grade every AP FRQ ever.
Find an FRQ
Stuck on AP Chemistry? Get unstuck with an AP specialist.1 to 1 tutors who know the exam inside out. Understand weeks of material in a single session.Find a Tutor
Learn AP Physics from scratch, quickly. This is the only course you'll need for the year.
A self-paced course with everything you need to get a 5. Trusted by over 15,000 students and 200+ schools. Learn fast, or we'll refund your purchase, backed by our 100% satisfaction guarantee.
Explore the Course
AP aligned mock tests to help you get a 5.
With grading, adaptive explanations, and more.
Find a Quiz
Find, solve, and grade every AP FRQ ever.
Find an FRQ
Stuck on AP Chemistry? Get unstuck with an AP specialist.1 to 1 tutors who know the exam inside out. Understand weeks of material in a single session.Find a Tutor
Learn AP Physics from scratch, quickly. This is the only course you'll need for the year.
A self-paced course with everything you need to get a 5. Trusted by over 15,000 students and 200+ schools. Learn fast, or we'll refund your purchase, backed by our 100% satisfaction guarantee.
Explore the Course